Monitoring Covid-19 patients with RedisTimeSeries

The past few weeks have been strange, our lives were indeed changed with the Covid-19 outbreak. The virus has really affected us in many ways and brought a new phrase to our lives, social distancing. Social distancing affected our work, family life and one of the implications is, of course, health care. Since the outbreak, we are looking for ways to better treat and understand Covid-19. During my work, I encountered a use case, where a hospital wanted to develop remote monitoring, by using remote sensors, dashboards, and alerts. This use case brought me to think that this is a perfect use case to showcase RedisTimeSeries capabilities.
The Recipe
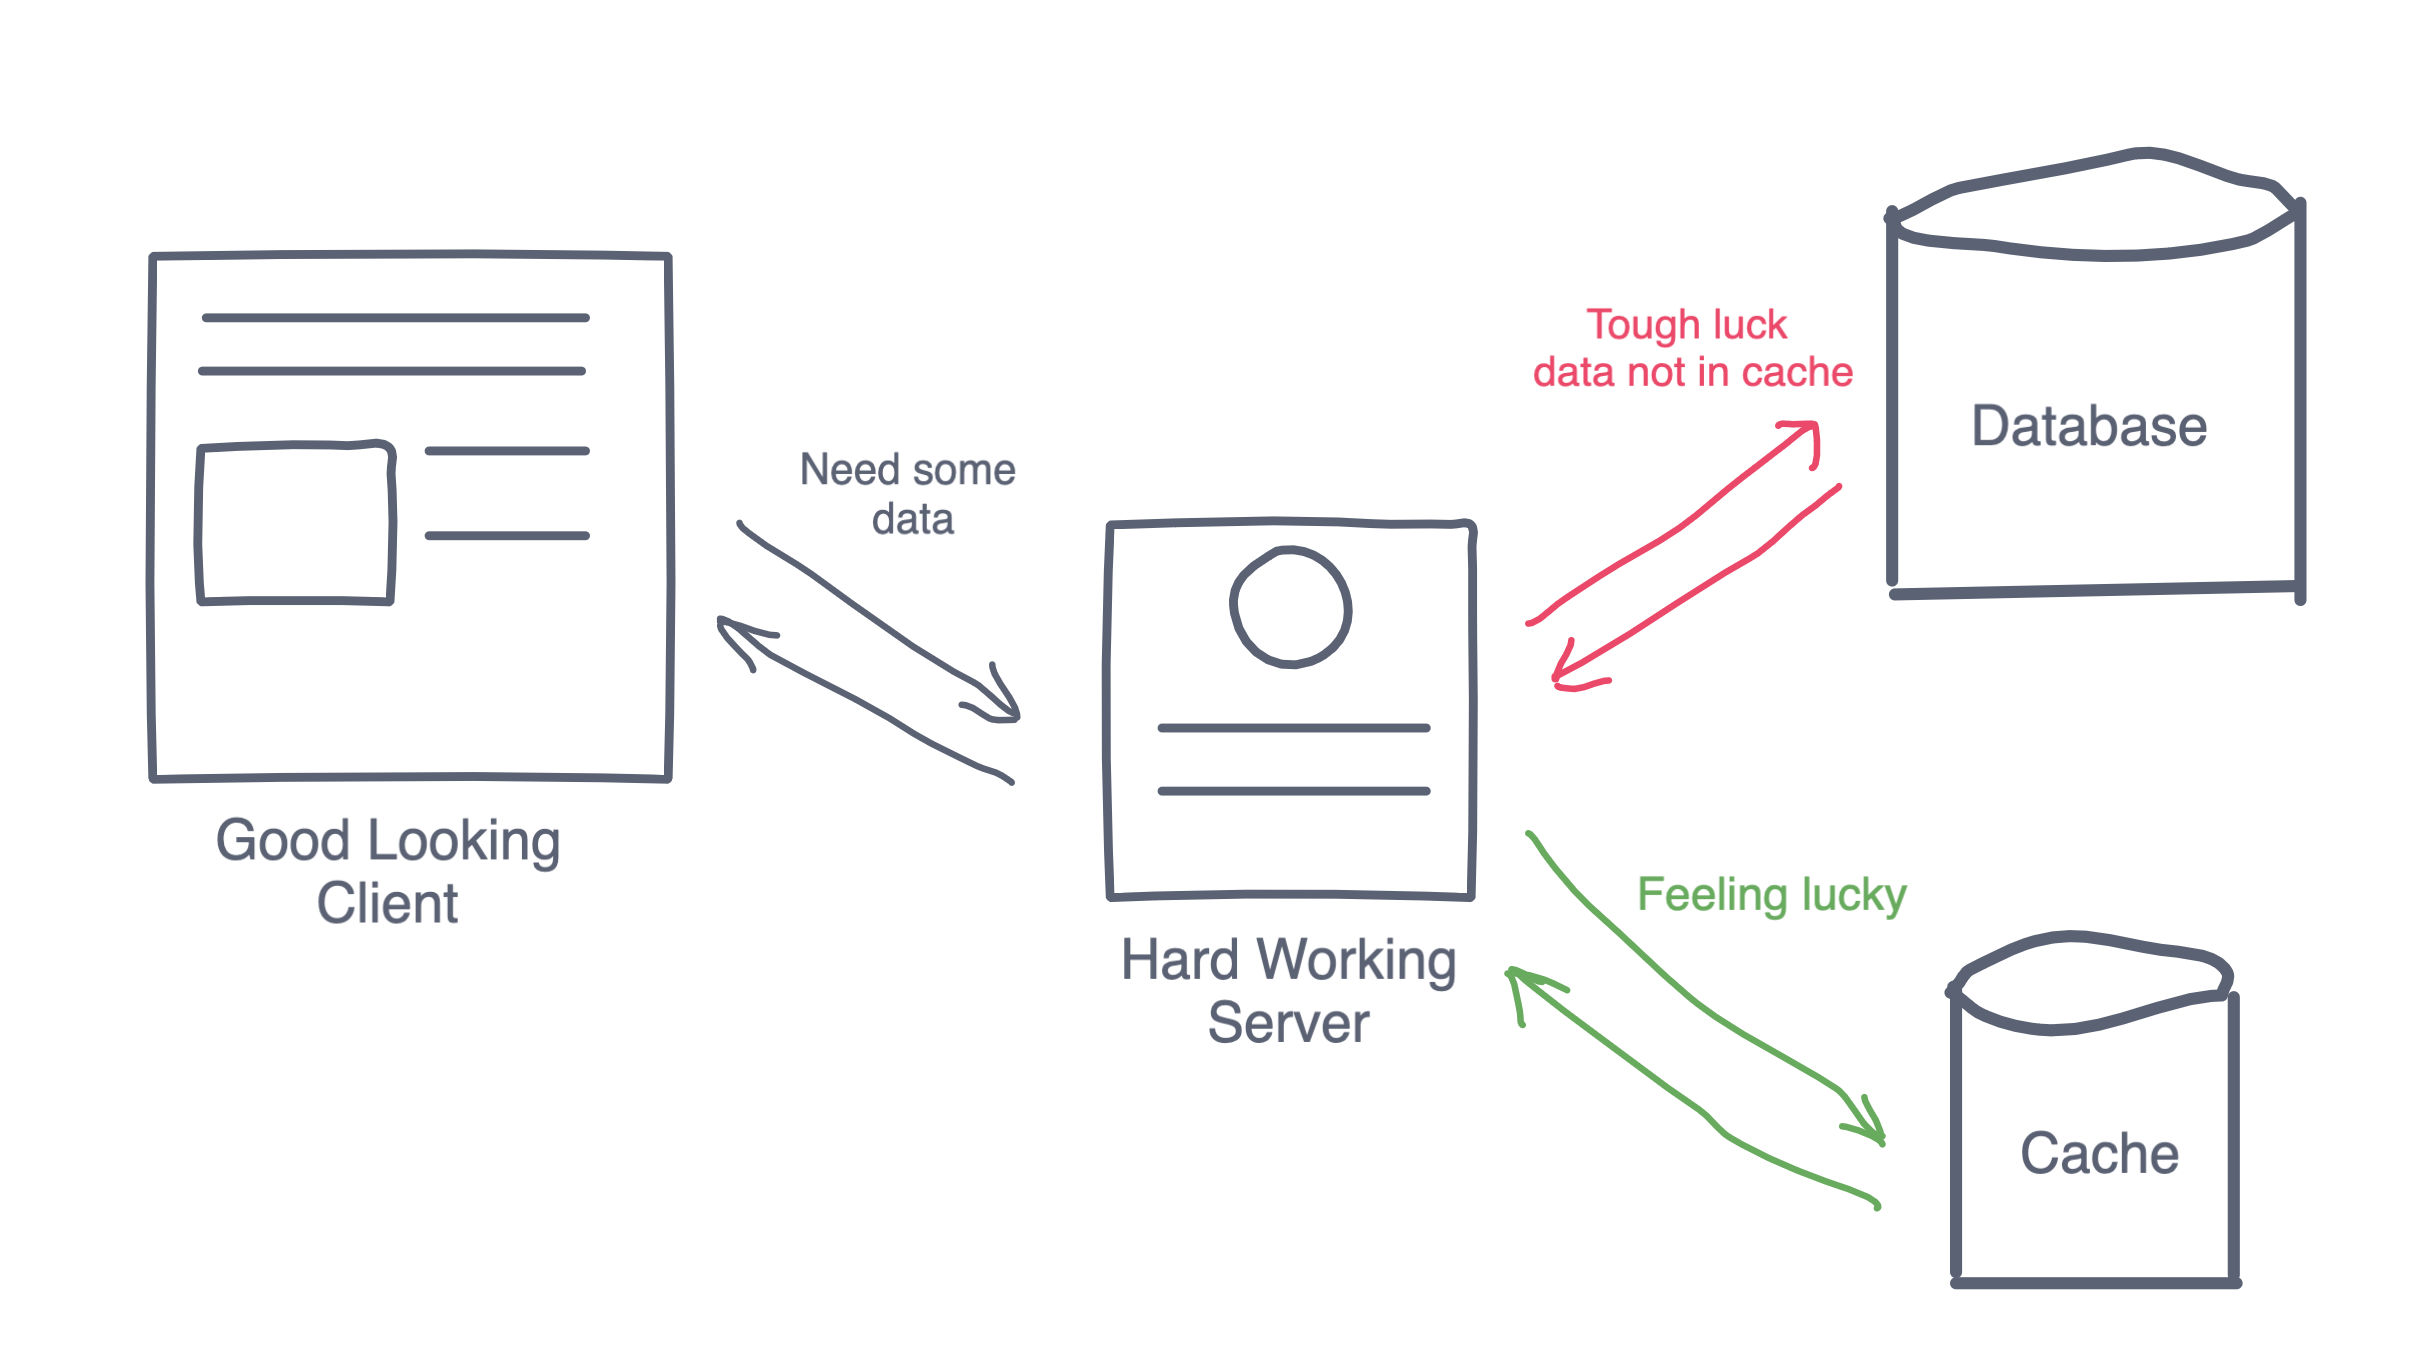
This recipe will collect 2 metrics from our patients, temperature, and heart rate. Patients metrics data will be pushed to Redis to the RedisTimeSeries module which can efficiently store time series data and can easily downsample the data according to our needs and has a built-in integration with Prometheus and Grafana.
- Redis - will act as our time series DB.
- Prometheus and Grafana - will be our visualization by creating a simple dashboard.
- RedisInsight - Redis visualization solution which can display among other RedisTimeSeries related data.
Preparing the ingredients
Like always the fastest way to prepare what we need is the Docker magic… If you look at RedisTimeSeries in the quickstart you can see that there is built-in integration with Prometheus and Grafana so we can use docker-compose to set all the pieces quite easily.
version: '3'
services:
  prometheus:
    image: "prom/prometheus:v2.8.0"
    command: ["--config.file=/prometheus.yml"]
    volumes:
      - ./prometheus.yaml:/prometheus.yml
    ports:
      - 9090:9090
  adapter:
    image: "redislabs/prometheus-redistimeseries-adapter:master"
    command: ["-redis-address", "redis:6379", "-web.listen-address", "0.0.0.0:9201"]
  redis:
    image: "redislabs/redistimeseries:edge"
    ports:
      - "6379:6379"
  grafana:
      image: grafana/grafana
      ports:
        - "3000:3000"
Then just run docker-compose up and we are all set to go
Producing the data
The next step is to produce some patient’s data, in order to generate some data I have used the redistimeseries-py You can find about clients here.
from redistimeseries.client import Client
import random, time

# our dataset will be for 4 patients
# each patient will be monitored by 2 devices and we will generate 1000 random sample values
numOfPatients = 4
numOfDevices = 2
numOfSamples = 1000
currentTime = int(time.time()*1000.0)

redisClient = Client(decode_responses=True)

# create a sample with the patient and device type label so we can query by label
def prodcueData(patient, deviceType, s):
    key = "patient:{0}:{1}".format(patient, deviceType)
    # the key also labled with the patient ID and the device type
    # this will allow us to query and filter in our dashboards
    redisClient.add(key, s + currentTime, random.uniform(1, 30),
        labels={'__name__':'patient', 'patient': patient, 'deviceType':deviceType})

for p in range(numOfPatients):
    for d in range(numOfDevices):
        for s in range(numOfSamples):
            prodcueData(p, d, s)
As you can see the code above simply pushes the patient’s data into Redis and also labels the data with patient ID and the device type to easily query and filter on our dashboards.
Let’s visualize
Now that we have some data in our Redis, let’s see the Grafana adapter and how do we create a simple dashboard.
If we have a quick look in our docker-compose file
  grafana:
      image: grafana/grafana
      ports:
        - "3000:3000"
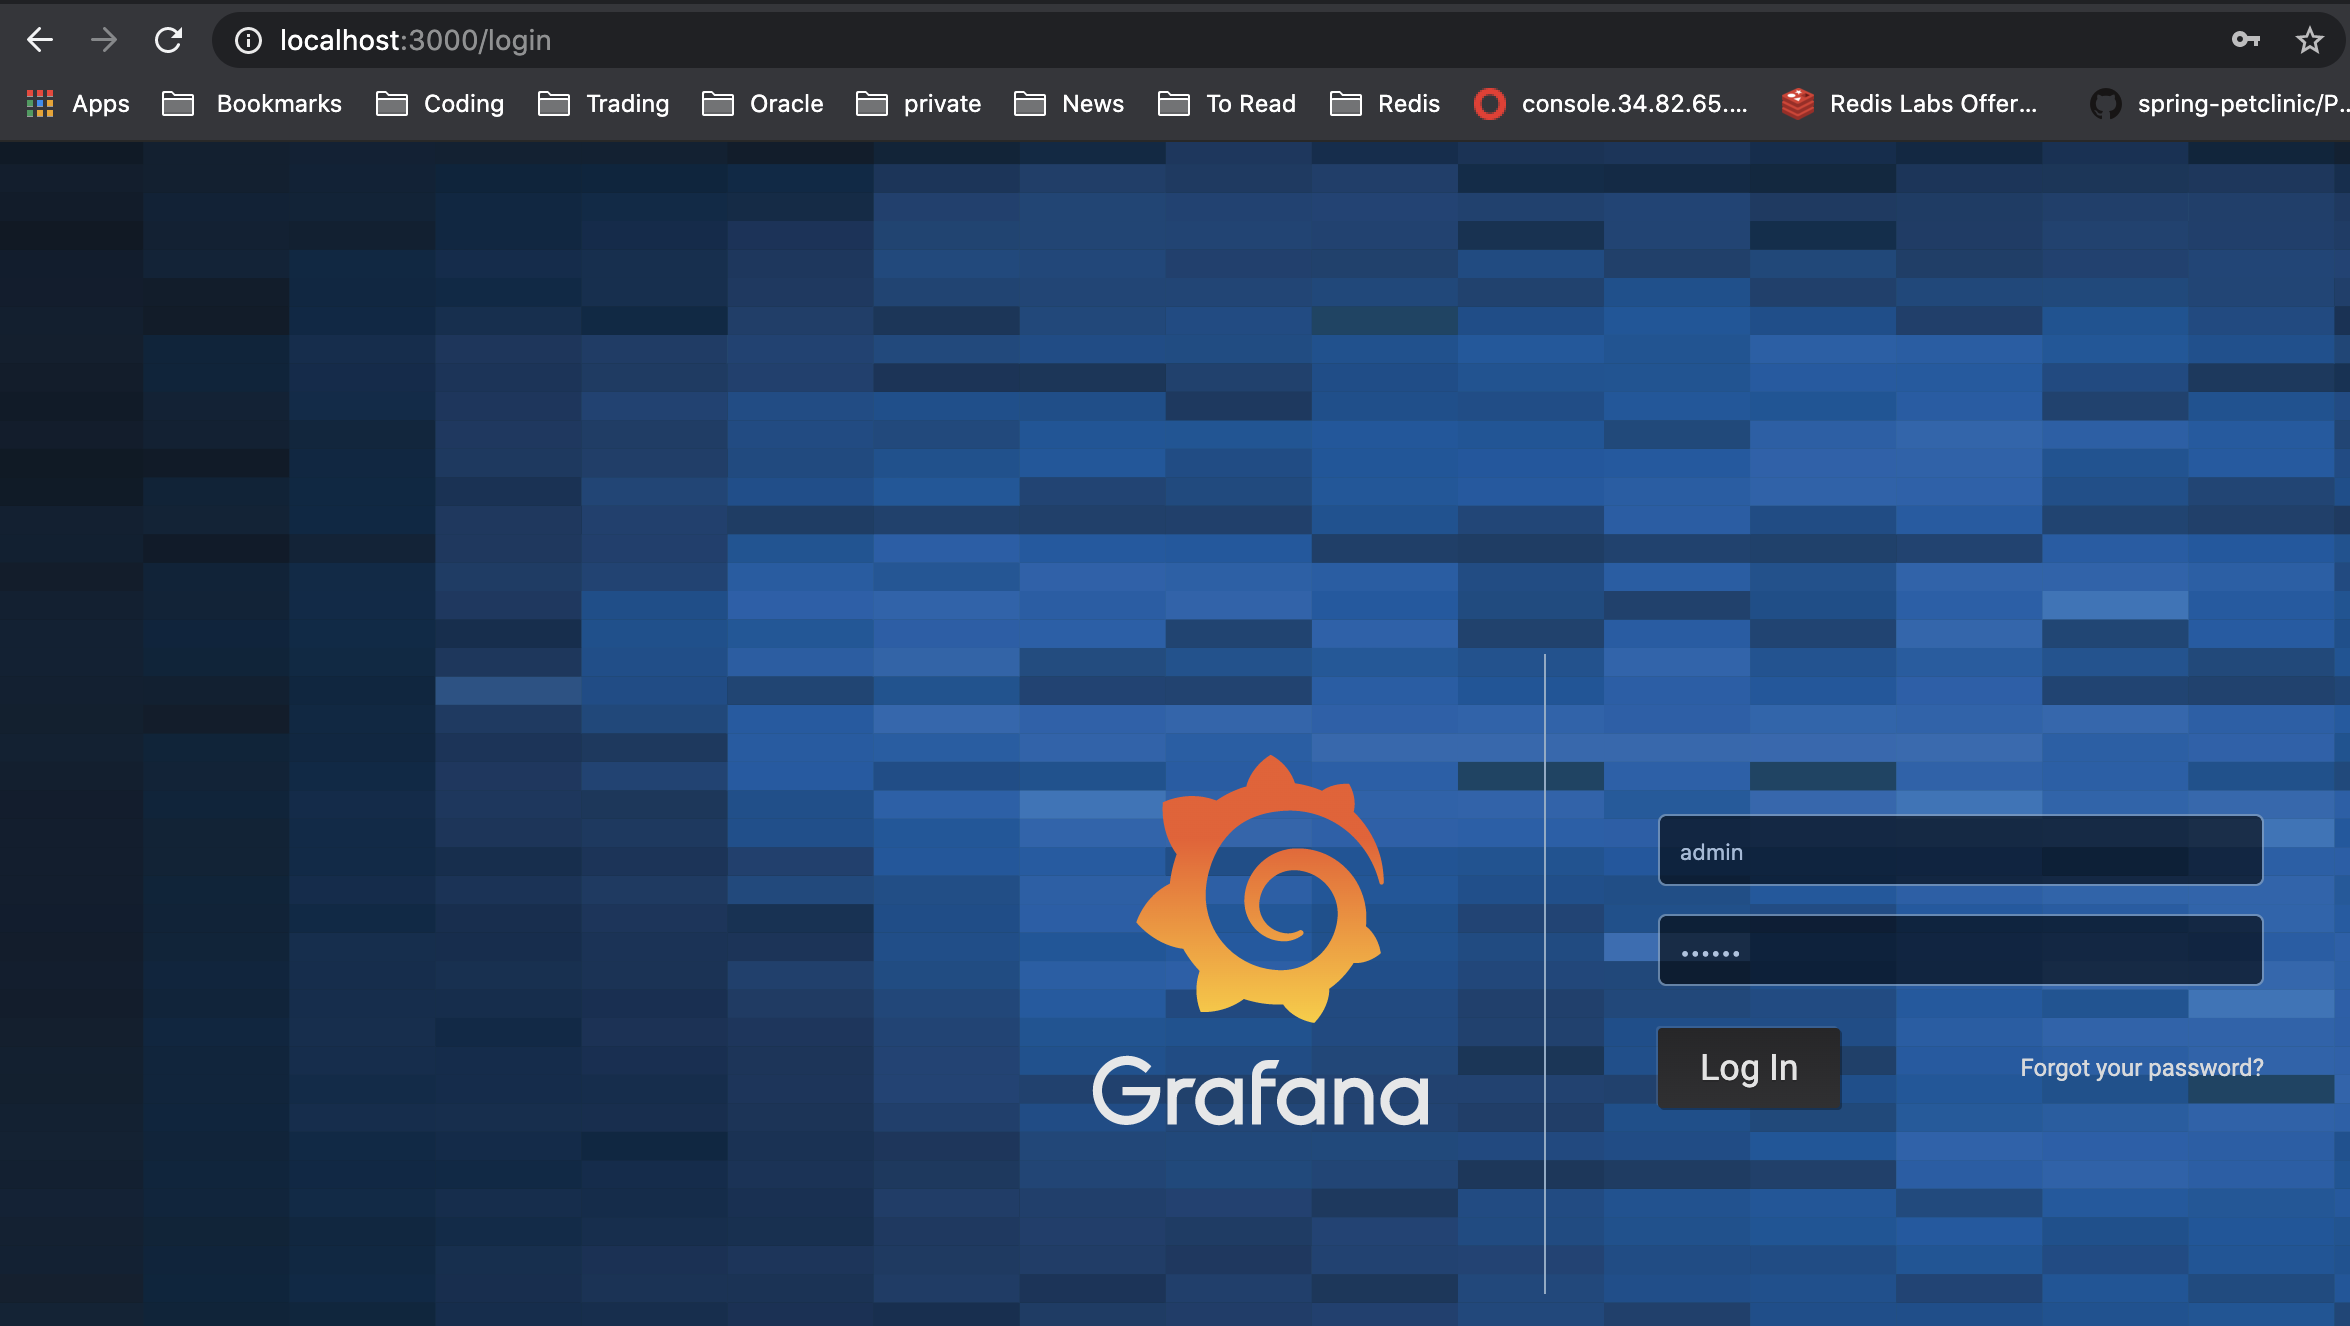
We can see that we have set Grafana on port 3000, so let’s login on http://localhost:3000/. If you have been paying attention then you should see something like this:
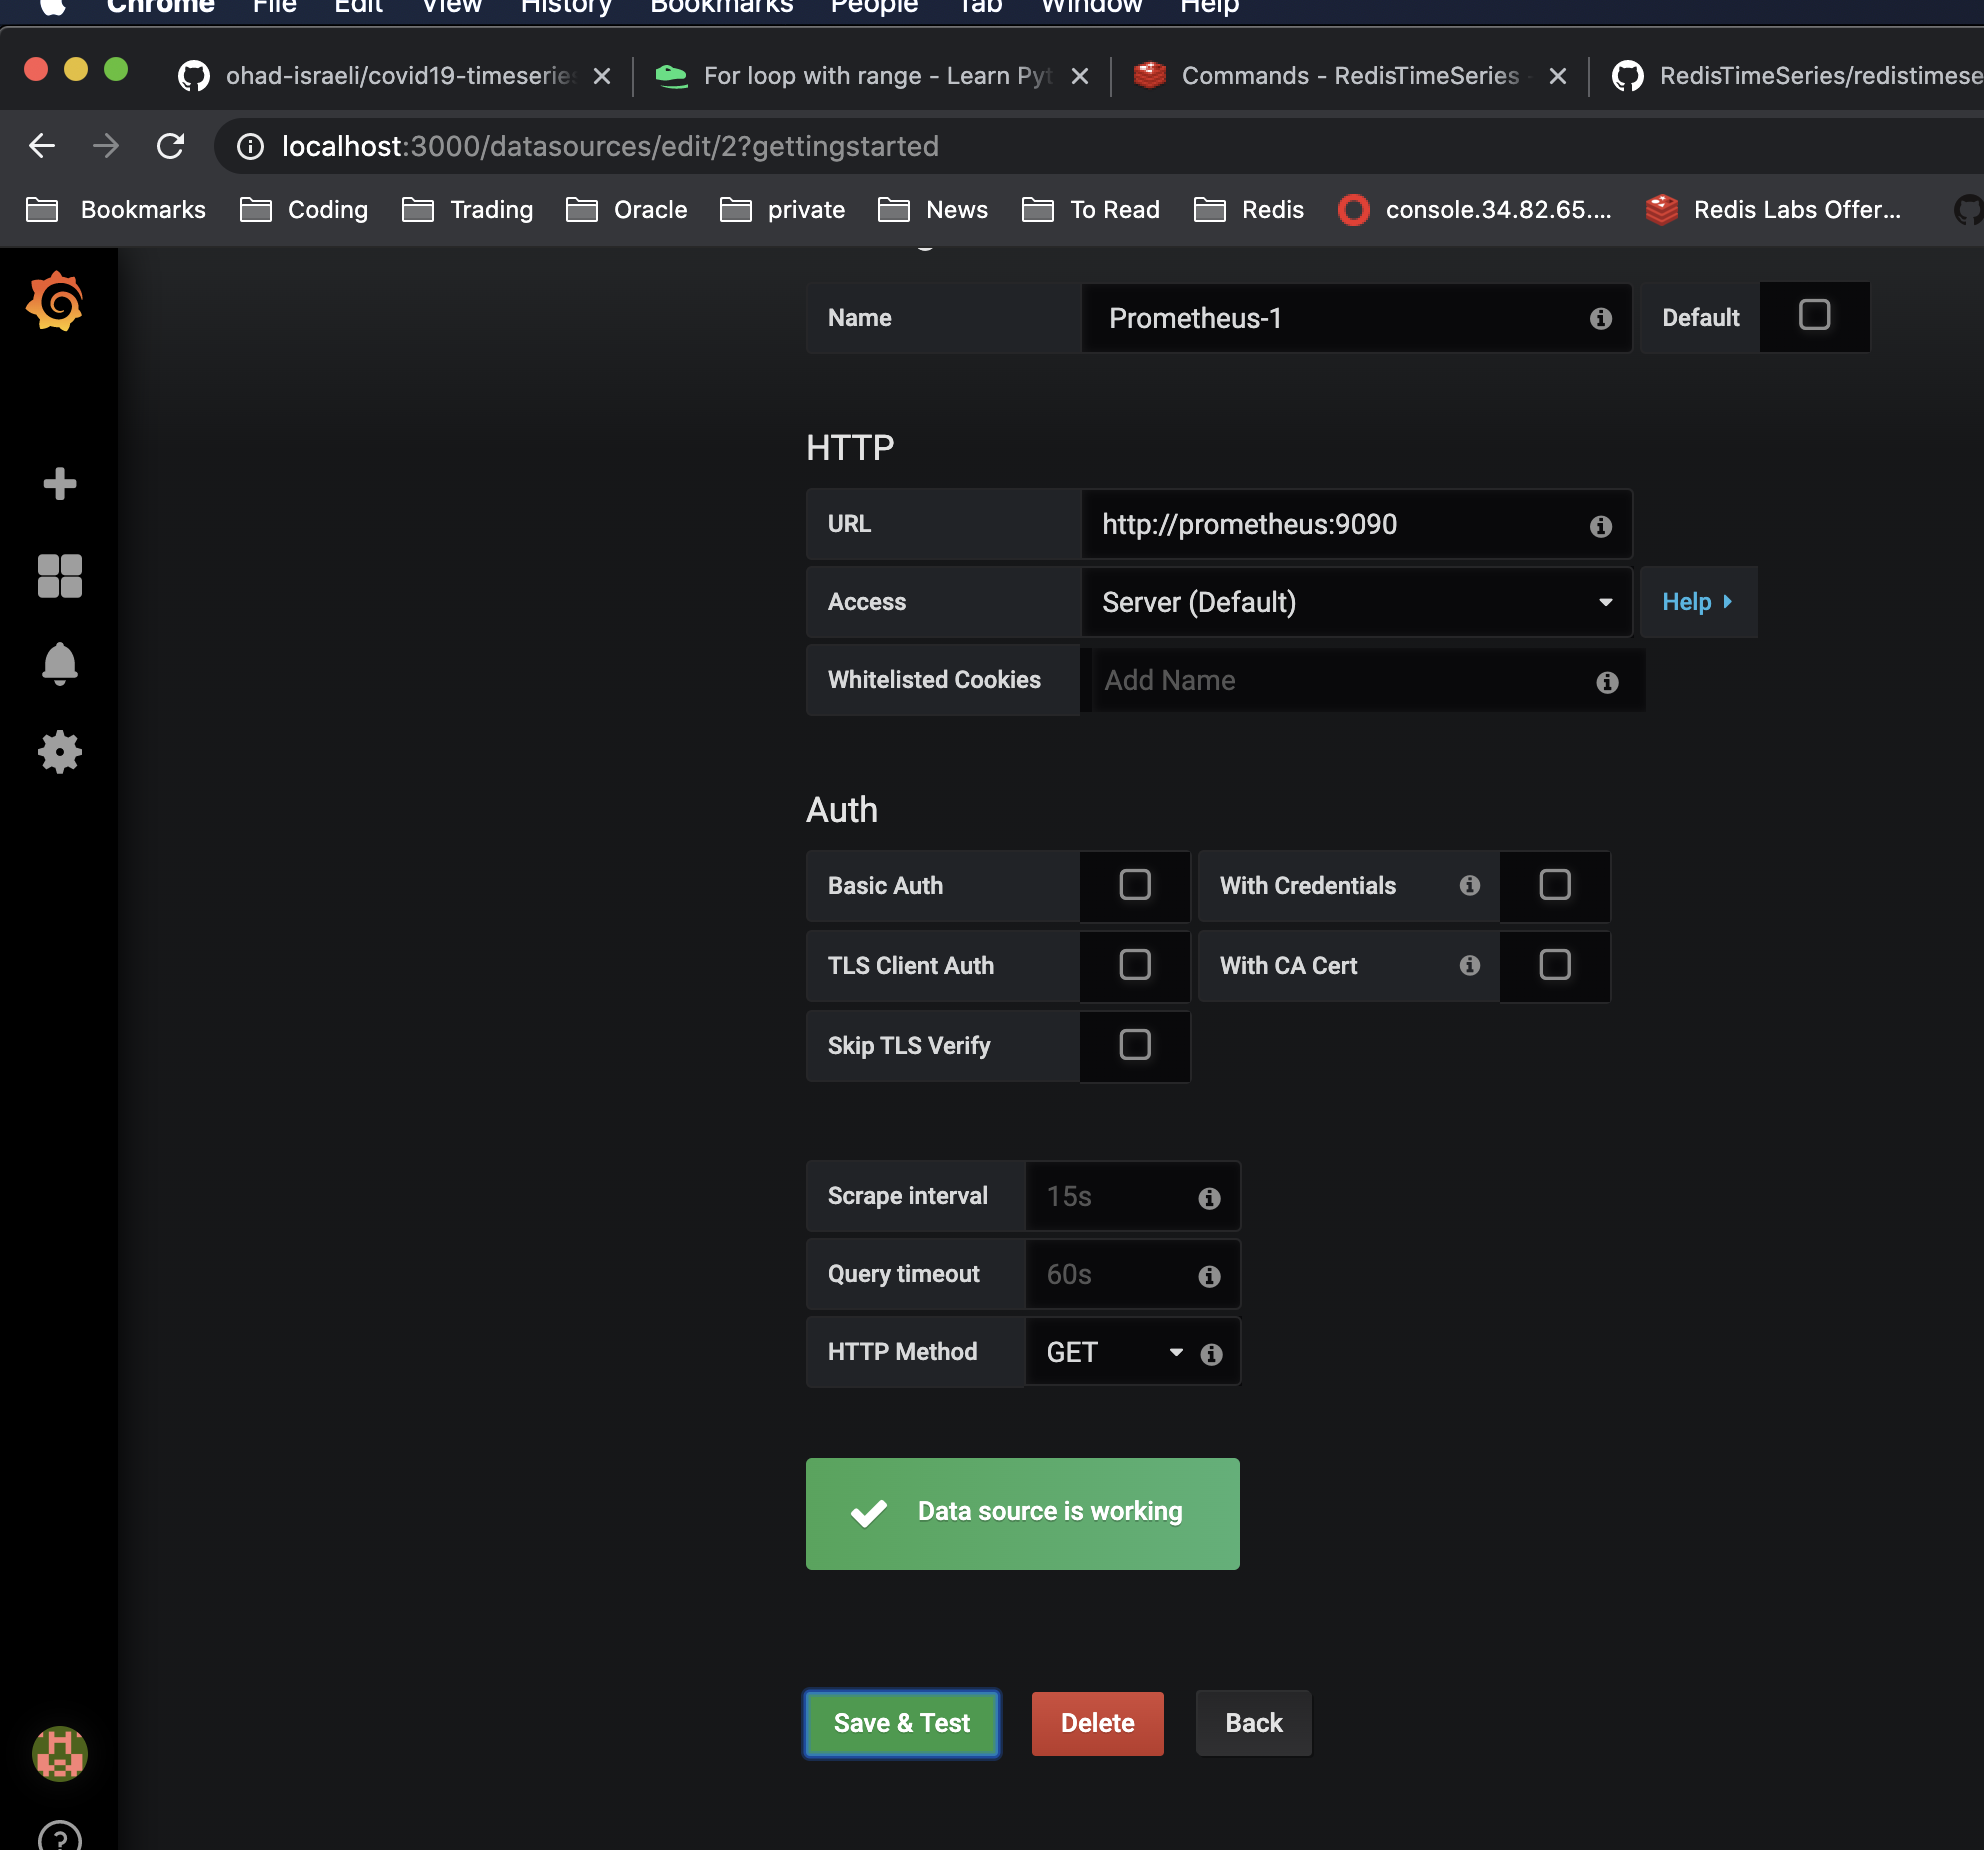
Once we are logged we need to first add our data source, let’s tie the magic again. If again we go back to the docker-compose then we can see that we have set up Prometheus as well.
  prometheus:
    image: "prom/prometheus:v2.8.0"
    command: ["--config.file=/prometheus.yml"]
    volumes:
      - ./prometheus.yaml:/prometheus.yml
    ports:
      - 9090:9090
So now all we need to do is simply state that we will connect to Prometheus using the default port which is 9090.
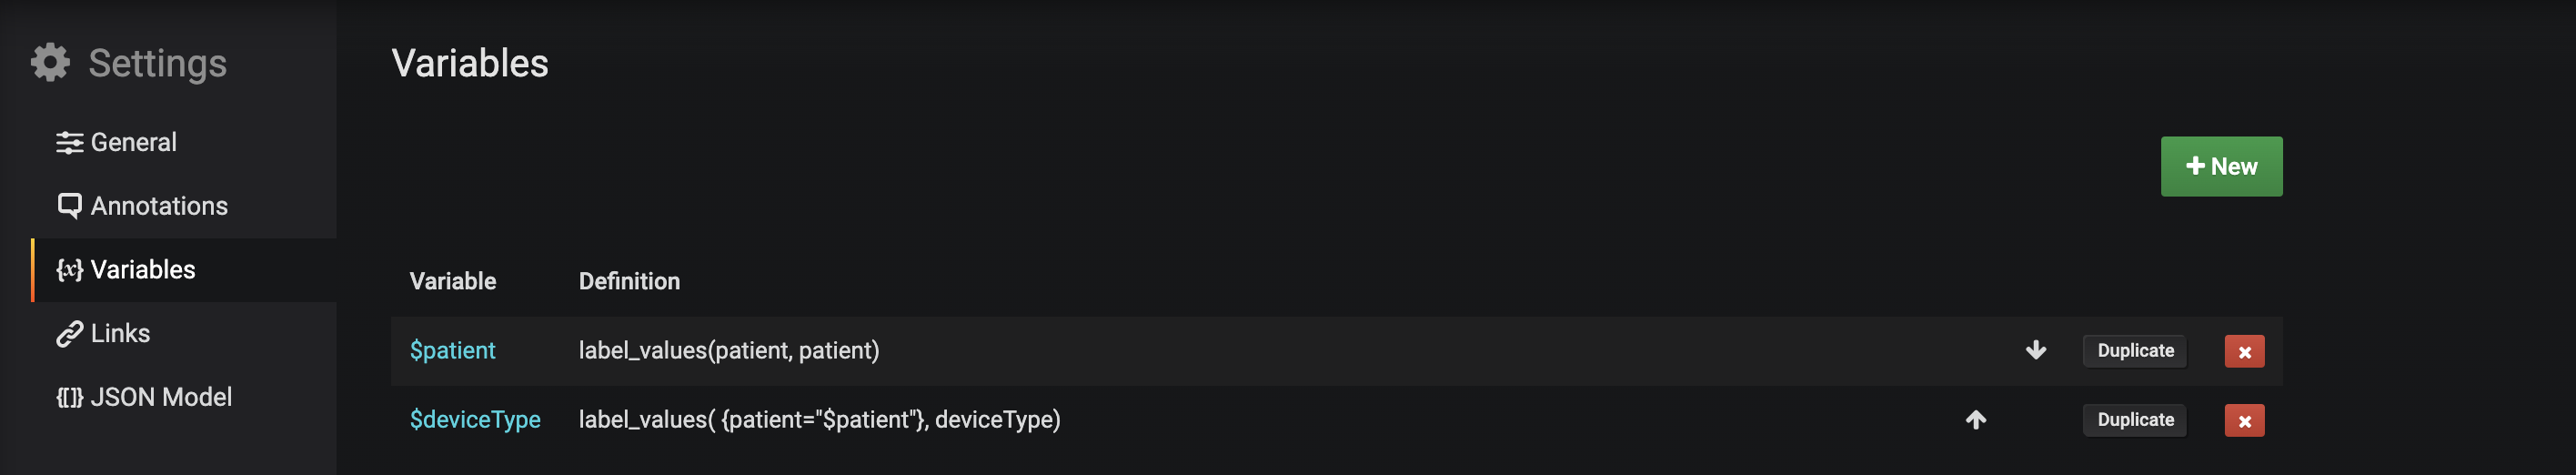
Now we can finally our dashboard, I will first create two variables so we can easily filter to the patient and the device. So first we will set two variables, the first will filter according to the patient ID.
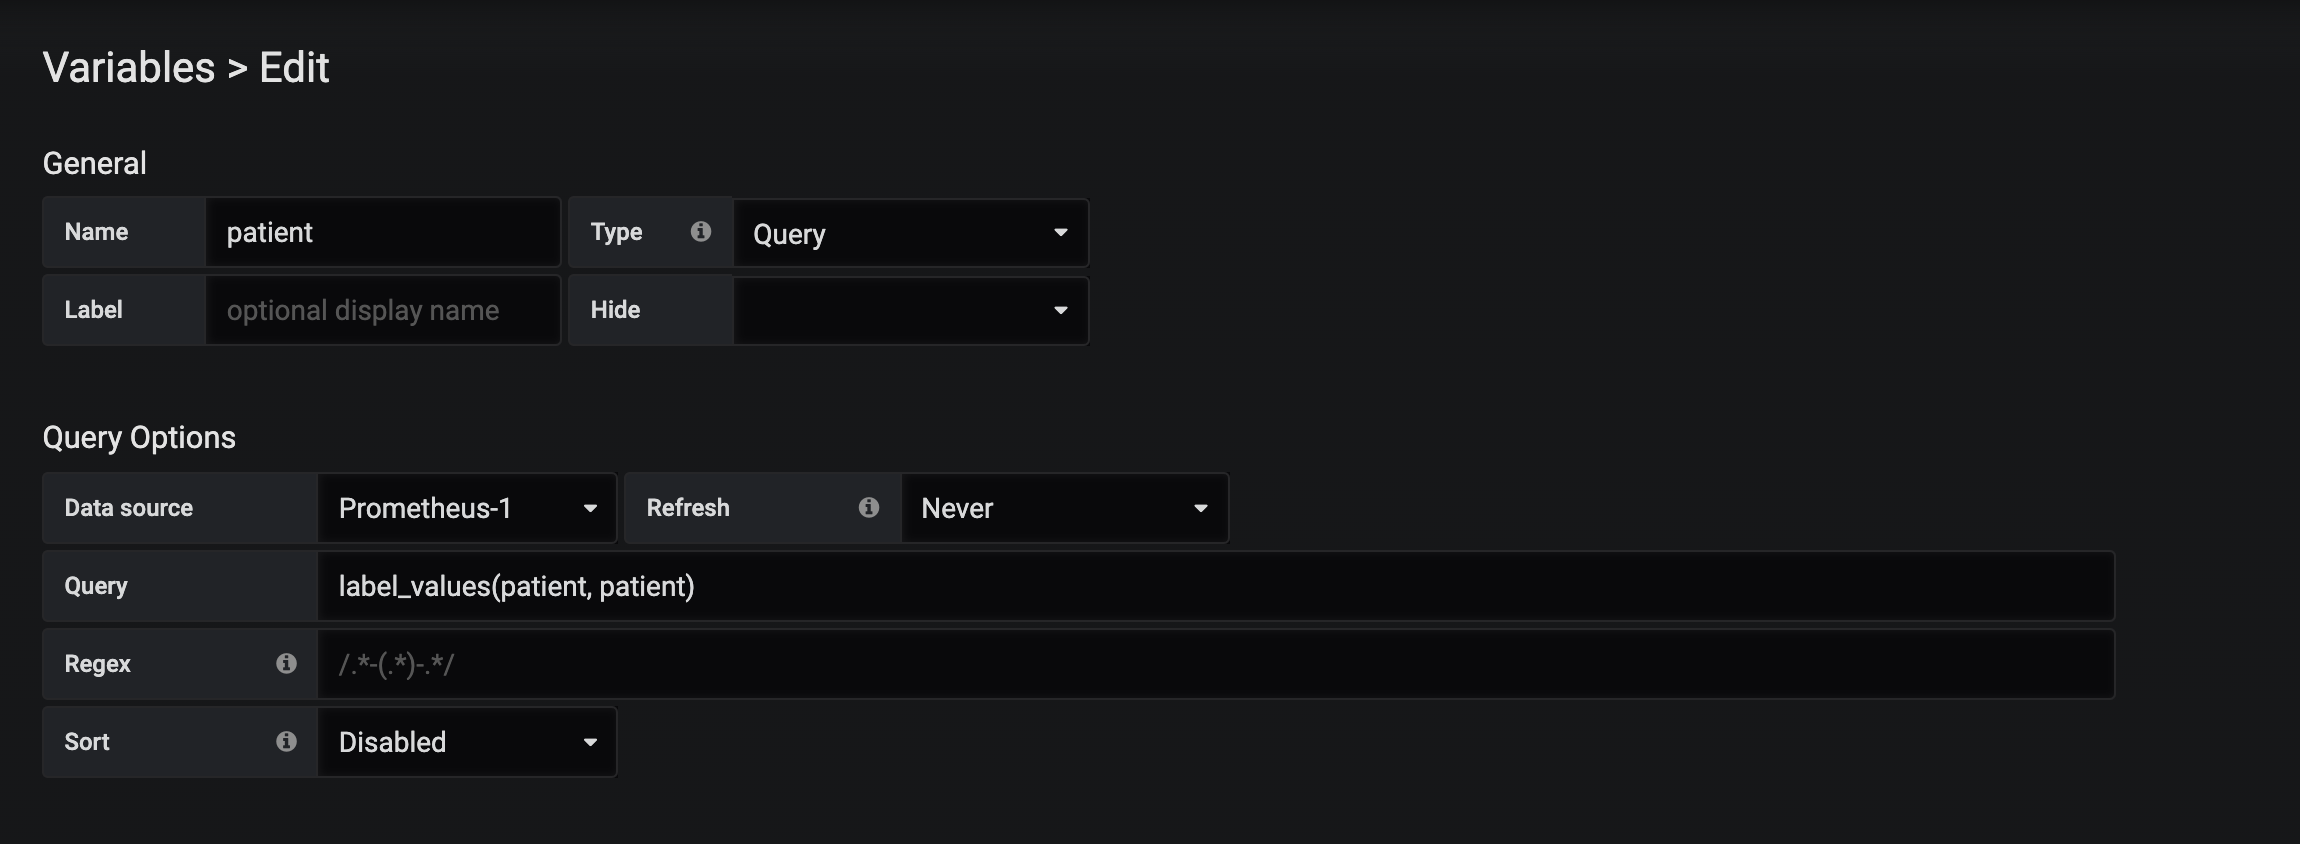
The second will filter device type according to the selected patient, below is both variables definition.
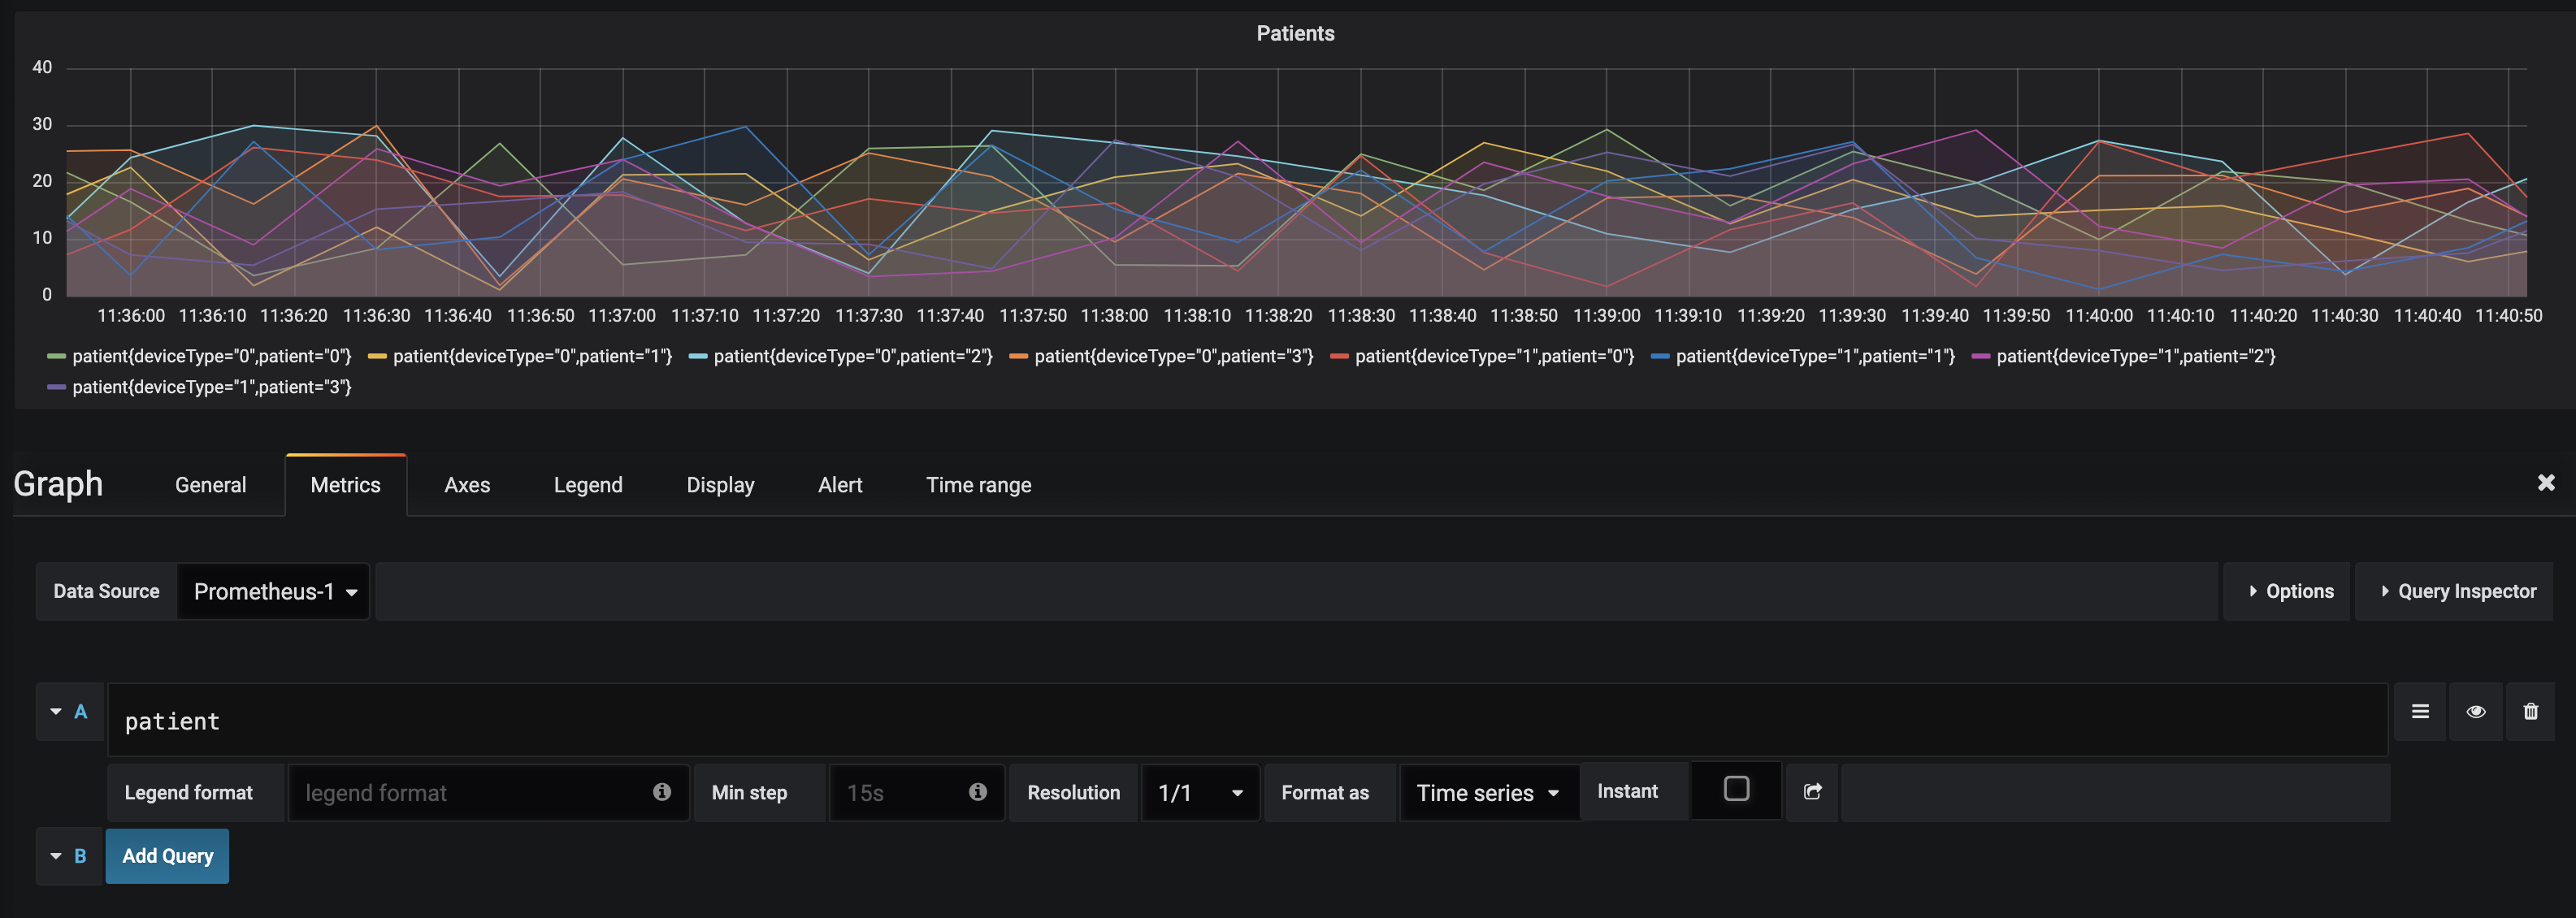
Now let’s create the first panel which will display patient’s data without any filter, including all device types and all the patients. In order to this, we need to make sure we select our data source and set the following query.
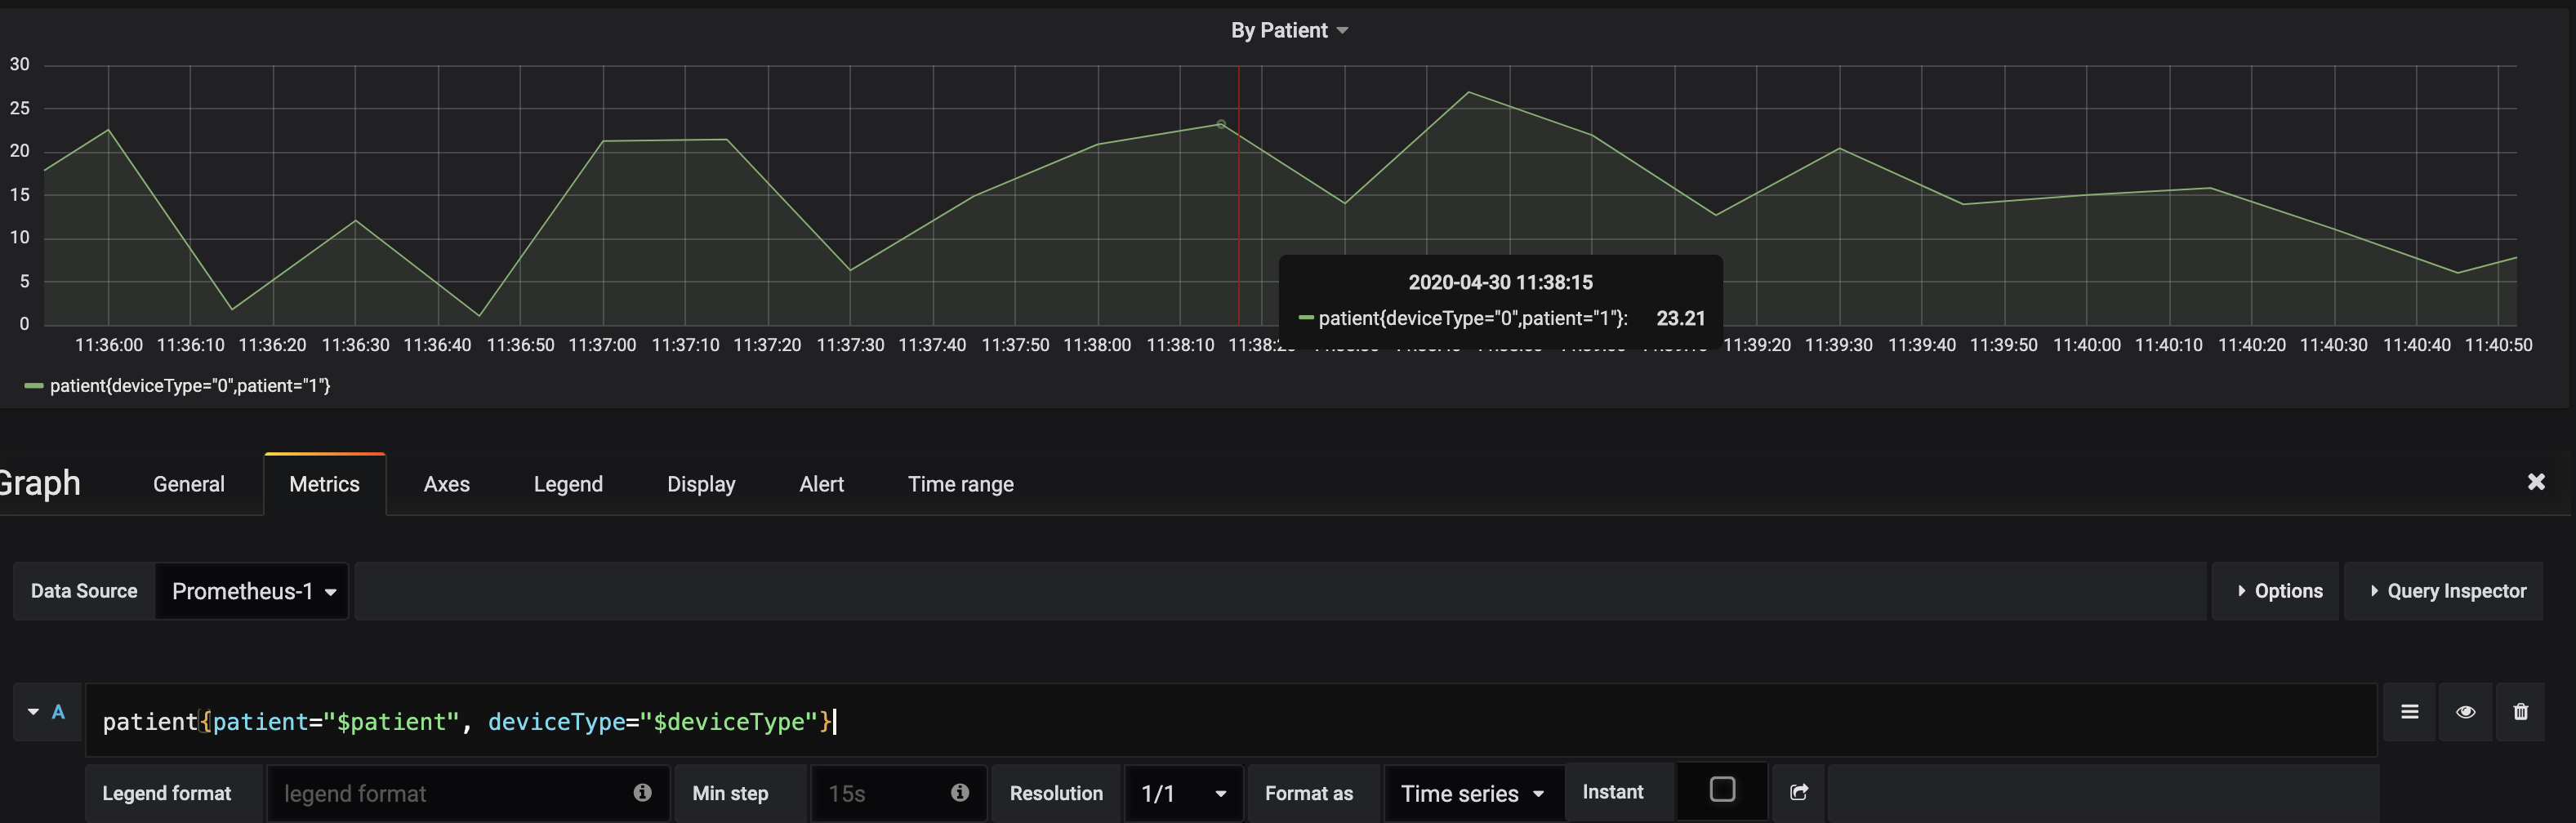
The second panel will filter the data according to the selected parameter this can be done using the following query
patient{patient="$patient", deviceType="$deviceType"}
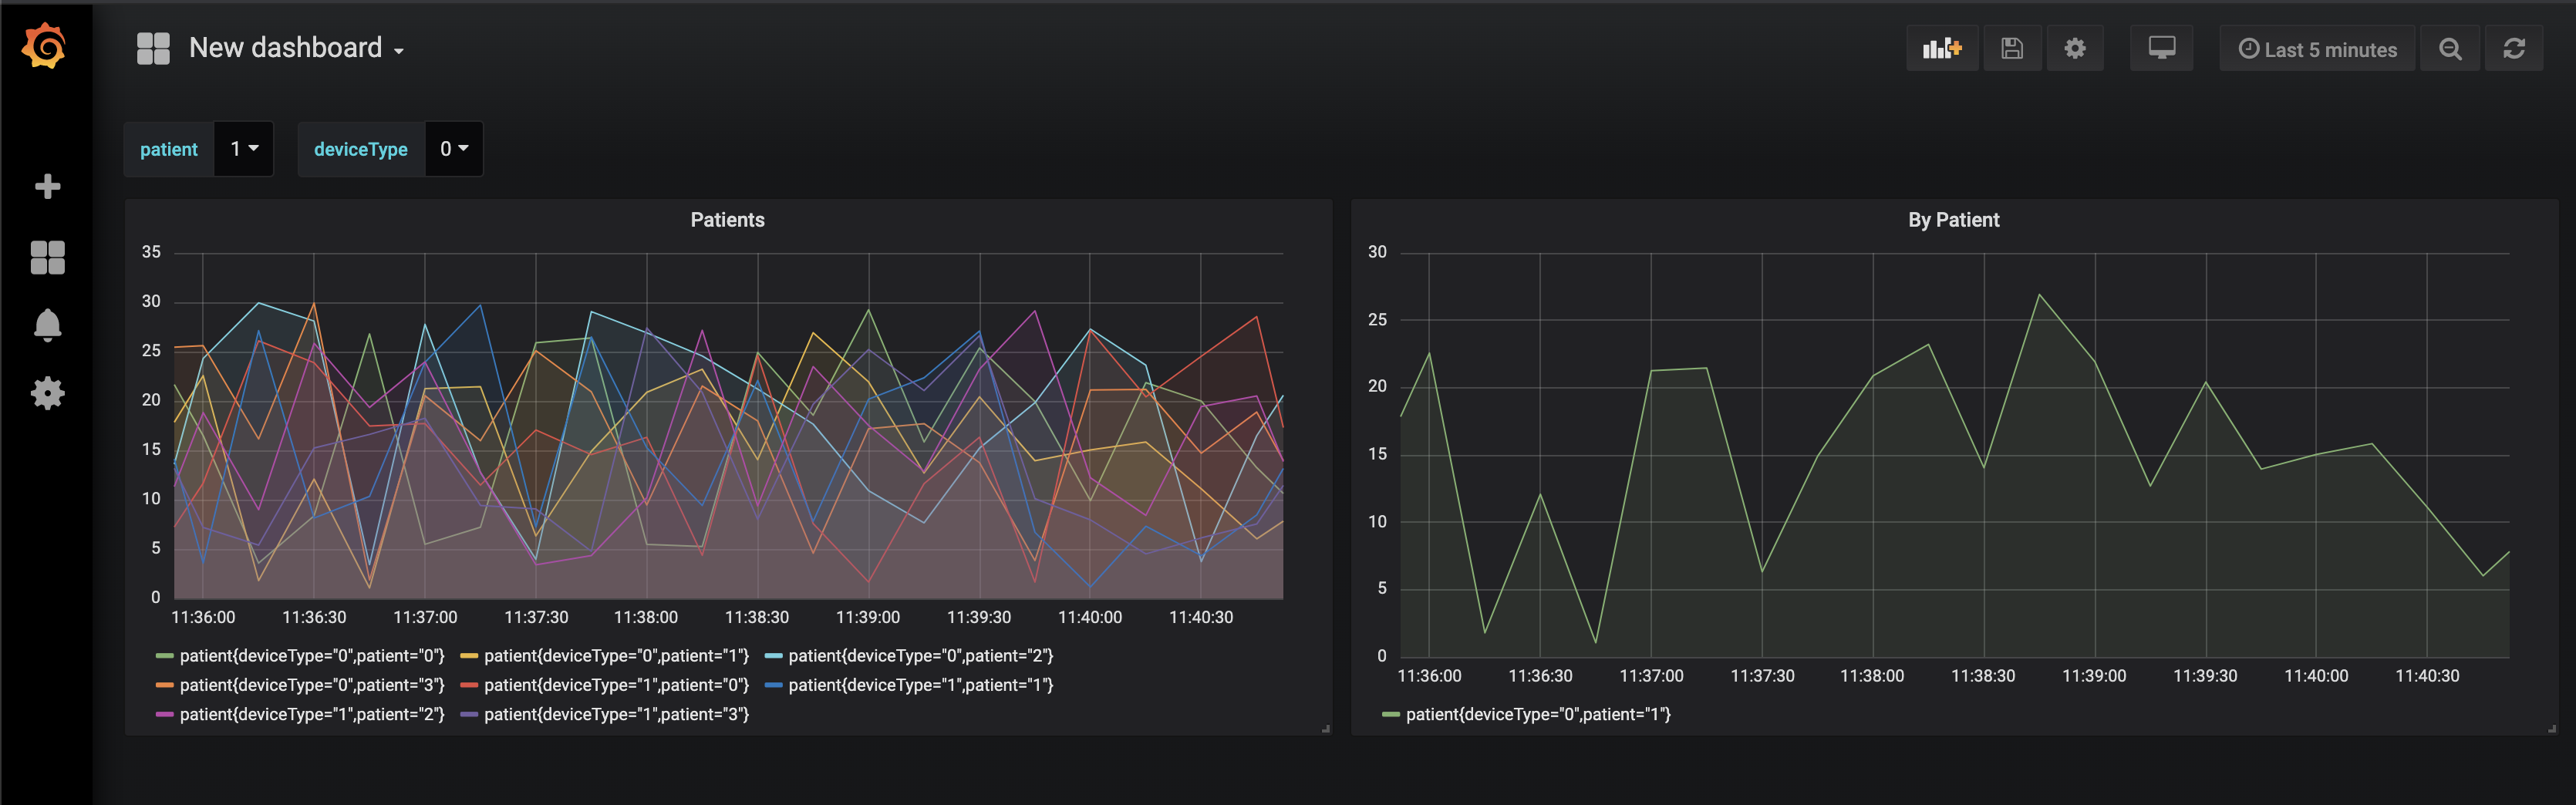
And the final result…
This is, of course, a simplified version of the use case, which also included downsampling in order to create dashboards with more relevant time frames, since most metrics do not change frequently temperature, saturation, and so on. You can check out for more information on RedisTimeSeries and additional capabilities that you can leverage for your applications.
You can find all the files that are needed to run this demo here, hope to see you soon on my next recipe…